Understanding SVD: The Intuition
In this project, I'm exploring what exactly SVD does and how matrix factorization works in recommendation systems. While I've worked with AI search indexing using semantic learning at work, I never directly implemented traditional ML-based recommendation systems in production. This is my attempt to deeply understand the fundamentals.
SVD - Singular Value Decomposition
Yes, mathematical terms can be intimidating 😟 But let's break it down with a simple analogy: sorting M&Ms, the candy! 🍫
The Big Picture: The M&M Sorting Analogy

Imagine you're sorting M&Ms. You could analyze thousands of tiny features: dents, exact shade, position of the "m", surface texture, etc. But what's the main feature that matters? Color — because it's what matters most for sorting them efficiently.
This is exactly what SVD does for ratings data:
- Your data has tons of "noise" (irrelevant variations)
- SVD finds the important patterns and ignores the noise
- It's like discovering "color is what matters" automatically, without being told
The Ratings Matrix: Our Starting Point
Our user-item rating matrix looks like this:
           iPhone  Headphones  Cable  Charger  ... (63,001 products)
Anisha        5         ?        4       ?
Daniel        ?         2        ?       3
John          5         ?        ?       ?
Keren         ?         ?        3       2
...
(192,403 users)
The problem: 99.9996% of the matrix is empty! This extreme sparsity creates noise and makes finding meaningful patterns incredibly challenging.
What SVD Does: Breaking Down the Matrix
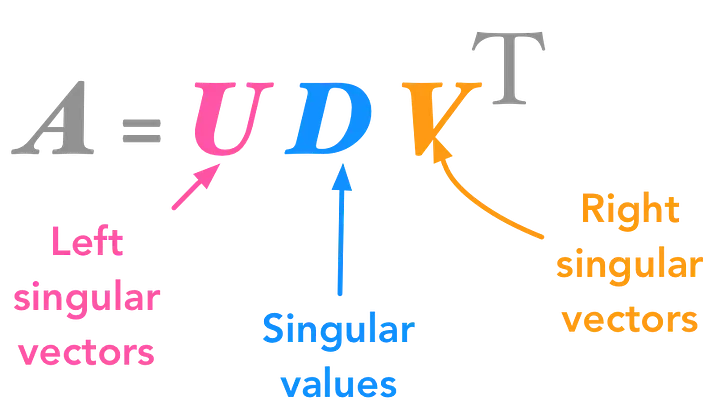
SVD factorizes our sparse ratings matrix into three smaller, denser matrices: U, Σ (Sigma), and VT
Ratings Matrix ≈ U × Σ × VT
1. U Matrix - "User Preference Patterns"
U contains the left singular vectors, which represent user preferences. Think of it as: "What type of shopper is each user?"
           Budget  Premium  Tech-Savvy  Brand-Loyal  ... (20 patterns)
Anisha       0.1     0.9      0.8         0.3
Daniel       0.8     0.1      0.2         0.1
John         0.2     0.8      0.9         0.7
Each number indicates how much that user aligns with each hidden pattern.
2. Σ Matrix - "Importance Scores"
The diagonal matrix Σ contains singular values ordered from high to low, telling us how important each dimension is in explaining the data. The singular values decrease with each dimension, meaning each subsequent dimension adds less value.
Pattern 1:  25.6  ← Most important (explains 40% of behavior)
Pattern 2:  18.3  ← Second most (explains 25% of behavior)
Pattern 3:  12.1  ← Third most (explains 15%)
...
Pattern 20:  0.8  ← Barely matters (mostly noise)
3. V Matrix - "Product Characteristic Patterns"
V contains the right singular vectors, which represent item characteristics. Think of it as: "What category does each product belong to?"
              Budget  Premium  Tech-Savvy  Brand-Loyal  ... (20 patterns)
iPhone         0.1     0.9      0.9         0.8
Headphones     0.7     0.2      0.4         0.1
Cable          0.9     0.1      0.1         0.0
How Predictions Work: The Dot Product
To predict Anisha's rating for an iPhone, we calculate the dot product of her user pattern vector with the iPhone's product pattern vector:
Anisha's pattern:  [0.1, 0.9, 0.8, 0.3, ...]  (20 numbers)
iPhone's pattern:  [0.1, 0.9, 0.9, 0.8, ...]  (20 numbers)

Dot product = (0.1 × 0.1) + (0.9 × 0.9) + (0.8 × 0.9) + (0.3 × 0.8) + ...
            = 0.01 + 0.81 + 0.72 + 0.24 + ...
            = 3.2  ← This becomes part of the rating prediction
What's happening:
- Anisha is "premium" (0.9) and iPhone is "premium" (0.9) → High match! (0.81)
- Anisha is "tech-savvy" (0.8) and iPhone is "tech-savvy" (0.9) → High match! (0.72)
- Result: Anisha will probably love the iPhone
The Three Magic Tricks SVD Does
1. Finds Important Patterns
SVD identifies the relevant sub-space within all the dimensions created by noise in the data. Like discovering that "color" matters most for M&Ms, SVD automatically discovers that "premium preference" or "tech enthusiasm" matters for electronics shoppers.
2. Ranks by Importance
Each component in the factorized matrices is ordered by importance — u1, σ1, v1 are the most important in describing the original matrix. This means we can keep only the top 20 patterns and ignore the rest (which are mostly noise).
3. Fills in the Blanks
Once it knows the patterns, SVD can predict missing ratings by matching user patterns with product patterns. Even though Anisha never rated AirPods, if her pattern shows she loves premium tech and AirPods have a strong premium tech pattern, SVD predicts she'll rate them highly.
Why This Solves the Sparsity Problem
Our 99.9996% sparse matrix looks impossibly empty, but it actually contains hidden patterns: premium buyers, budget hunters, tech enthusiasts, brand loyalists. SVD discovers these patterns automatically through mathematical decomposition.
Example:
- Anisha never rated "Wireless Earbuds"
- But SVD learned: Anisha likes premium tech (from her other ratings)
- And SVD learned: Wireless Earbuds are premium tech (from other users' ratings)
- Prediction: Anisha will rate Wireless Earbuds 4.8 stars!
The Bottom Line
SVD is pattern matching at massive scale, with patterns automatically discovered from data. It transforms an impossibly sparse problem into a manageable one by learning the hidden structure that explains why users rate items the way they do.
Before SVD: "Anisha rated iPhone 5 stars. Will she like AirPods?" → "I don't know, she never rated AirPods."
After SVD: "Anisha's pattern shows: premium (0.9), tech (0.8), Apple brand (0.7)" + "AirPods pattern shows: premium (0.9), tech (0.9), Apple brand (0.9)" = High match! Predicted rating: 4.8 stars ✨
Github repository here