Background
At the time of this experiment, Udacity courses currently have two options on the course overview page: "start free trial", and "access course materials".
Experiment Description
In the experiment, Udacity tested a change where if the student clicked “start free trial”, they were asked how much time they had available to devote to the course.
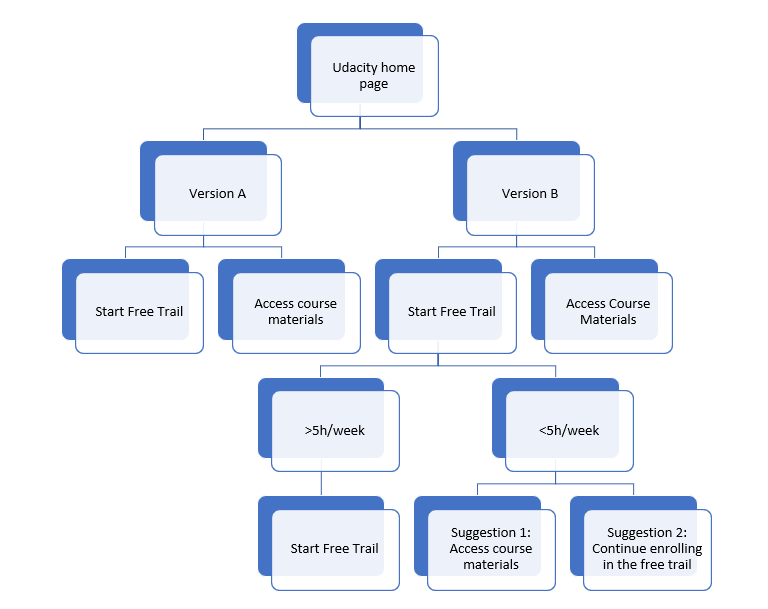
Here is a screenshot of what the experiments look like:-

Hypothesis
Experiment Setup
Unit of Diversion: CookieMetric Choice
Two types of metrics are selected for a successful experiment: Invariant and Evaluation metrics
Invariant Metrics
Invariant metrics are used for sanity checks or A/A experiment before running the experiment, such as checking if the distributions are the same between control and experiment group, to make sure our experiment is not inherently wrong. Invariant metrics usually have a larger unit of diversion, randomly selected, or happens before the experiment starts.
In this case, the goal of measurement is how many students will allocate more than 5 hours a week for Udacity courses, which happens before students enrolling in the courses. And thus the clicks and cookies related metircs are for the invariant metircs.User-id, however, will be tracked after enrolling the course,which is not effective.
Evaluation Metrics
Evaluation metrics are the metrics in which we expect to see a change, and are relevant to the business goals we aim to achieve. For each metric we state a Dmin - which marks the minimum change which is practically significant to the business. For instance, stating that any increase in retention that is under 2%, even if statistically significant, is not practical to the business
Gross Conversion will be a good metric. Gross conversion means the number of enrolled divided by number of clicks. And thus in the experiment group, we hypothesized the number of enrollment will decrease after answering the screener questions, given those who selected <5 hour will not be encouraged to enroll.
Retention ratio can also be a good evaluation matric because the retention ratio in experiment group is expected to be higher because of low enrolment , if experiment meets the assumption. After seeing the message , there might be fewer users who would enrol and hence retention would be higher because it should filter out those users who can leave the course as frustrated user.
Net conversion is number of user-ids to remain enrolled past the 14-day boundary (and thus make at least one payment) divided by the number of unique cookies to click the ”Start free trial” button. As per the intention and assumption of the experiment , experiment group users are made aware that the course require some minimum of hours each week by showing the pop message at the time of enrolment. This message should filter out those users who cannot devote the required hours and are prone to be frustrated later on. This ratio should be different among control group users and experiment group users, if experiment’s assumptions holds true.Hence , it can be used as evaluation metric
Gross Conversion, will show us whether we lower our costs by introducing the new pop up. Net conversion will show how the change affects our revenues. After the experiment, we expect that, Gross conversion should have a practically significant decrease, and Net conversion should have a statistically significant increase.
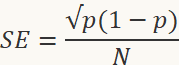
Measuring Standard Deviation of evaluation metrics
For each of the metrics the standard deviation is calculated for a sample size of 5000 unique cookies visiting the course overview page. It is asked to calculate the variability of the metrics, i.e. standard deviation of them. It is probably the “standard deviation of the sampling distribution” or standard error(SE), rather than the simple SD.
| Unique cookies to view course overview page per day: | 40000 |
| Unique cookies to click "Start free trial" per day: | 3200 |
| Enrollments per day: | 660 |
| Click-through-probability on "Start free trial": | 0.08 |
| Probability of enrolling, given click: | 0.20625 |
| Probability of payment, given enroll: | 0.53 |
| Probability of payment, given click | 0.1093125 |
CTR = 0.08 (given)
Number of users who clicked the Start Free Trial button = 5000* CTR= 5000* 0.08 = 400
Enrolment rate = Cookies to click Start Free trail/ Enrolments per day= 3200/660 = 0.20625
Number of users who enrolled in the free trial = 5000* CTR * Enrolment Rate = 5000*0.08*0.20625 = 82.5
Gross Conversion SD = 0.0202
Retention Ratio SD = 0.0549
Net Conversion SD = 0.0156
- The Unit of Diversion is equal to the Unit of Analysis for Gross Conversion and Net Conversion. Thus the analytical estimate would be comparable to the empirical variability.
- For Retention the Unit of Analysis is “ Number of users who enrolled in the courseware ” which is not equal to the Unit of Diversion. Hence the empirical variability may be different from the Analytical estimate.
Sizing
Number of Samples vs. Power
We will not be using Bonferroni correction during analysis phase.
Using the online calculator , we calculated number of samples required as following:
alpha:5% beta:20%
Number of groups = 2 (control and experimental)
Probability of enrolling , given click: 20.625%, base conversion rate, 1% min d.
Samples needed: 25,835
Pageviews = Samples needed * 2/CTR = 645,875
Probability of payment , given enroll: 53%, base conversion rate, 1% min d.
Samples needed: 39,115
Pageviews = Samples needed * 2/CTR = 4,741,212
Probability of payment, given click: 10.93125% base conversion rate, 0.75% min d.
Samples needed: 27,413
Pageviews = Samples needed * 2/CTR = 685,325
Pageviews Required: 4,741,212
Duration vs. Exposure
If we divert 100% of traffic, given 40,000 page views per day, the experiment would take about 119 days.
This duration with full diversion is too time consuming for running an experiment and presents some potential risks for business, such as frustrated students, lower conversion and retention, and inefficient use of coaching resources, and the opportunity riks of performing other experiments.
Therefore, if we eliminate retention, we are left with Gross Conversion and Net Conversion, and the pageview requirement will be reduced to to 685,325, and an about 18 day experiment with 100% diversion and or 35 days given 50% diversion. In terms of timing, an 18 day experiment is more reasonable.
Experiment Analysis
The experimental data can be found here
Sanity Checks
Number of Cookies/Pageviews & Number of Clicks:
|
|
Pageviews |
Clicks |
CTR |
|
N_control |
345543 |
28378 |
|
|
N_experiment |
344660 |
28325 |
|
|
N_total |
690203 |
56703 |
|
|
p |
0.5 |
0.5 |
0.08213 |
|
phat |
0.5006 |
0.5005 |
0.08215 |
|
SE |
0.0006 |
0.0021 |
0.00047 |
|
m |
0.0012 |
0.0041 |
0.00092 |
|
Lower bound |
0.4988 |
0.4959 |
0.08121 |
|
Upper bound |
0.5012 |
0.5041 |
0.08304 |
Since observed value of 0.5006 , 0.5005 and 0.08215 is within the expected range all metrics pass the Sanity Check.
The workings are carried out in the excel sheet
Result Analysis
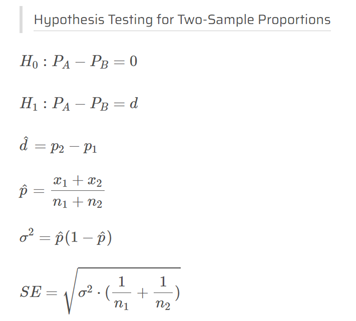
Effect Size Tests
A metric is statistically significant if the confidence interval does not include 0 (that is, you can be confident there was a change), and it is practically significant if the confidence interval does not include the practical significance boundary (that is, you can be confident there is a change that matters to the business.)
Number of Cookies/Pageviews & Number of Clicks:
|
|
Control |
Experiment |
|
Enrolment |
3785 |
3423 |
|
Payment |
2033 |
1945 |
|
Total clicks till 23 customers |
17293 |
17260 |
|
dmin |
0.0100 |
0.0075 |
|
prob of gross conv |
0.2189 |
0.1983 |
|
prob of net conv |
0.1176 |
0.1127 |
|
phat |
0.2086 |
0.1151 |
|
SE |
0.0044 |
0.0034 |
|
m |
0.0086 |
0.0067 |
|
Metric |
dmin |
Observed Difference |
CI Lower Bound |
CI Upper Bound |
Result |
|
Gross Conversion |
0.01 |
-0.0206 |
-0.0291 |
-0.0120 |
Statistically and Practically Significant |
|
Net Conversion |
0.0075 |
-0.0049 |
-0.0116 |
0.0019 |
Neither Statistically nor Practically Significant |
Practical significance was determined based on minimum detectable effect (dmin) parameter. The dmin for Gross conversion was set at 0.01 and for Net conversion was set at 0.0075. For Gross conversion, our observed value is more than two below the practical significance boundary, and the confidence interval does not include zero. Hence, Gross conversion is both statistically and practically significant. However, for Net Conversion our observed value is well within the boundaries of practical significance, and confidence interval includes a zero. Hence, Net conversion is neither statistically nor practically significant.
Sign Test
I used online sign test calculator to calculate p-values. Following are the results.
Gross Conversion:
alpha_individual = 0.05
|
Number of Success- Where exp Gross Conversion is greater than control group’s Gross conversion |
4 |
|
Number of Failure- Where exp Gross Conversion is less than control group’s Gross conversion |
19 |
|
Number of days |
23 |
|
Probability |
0.5 |
|
Two tailed p-value |
0.0026 |
We can see that two tailed p-value is less than our alpha value hence results are statistically significant.
Net Conversion:
alpha_individual = 0.025
|
Number of Success- Where exp net conversion is greater than control group’s Gross conversion |
10 |
|
Number of Failure- Where exp net conversion is less than control group’s Gross conversion |
13 |
|
Number of days |
23 |
|
Probability |
0.5 |
|
Two tailed p-value |
0.6776 |
The result is not statistically significant , which is inline with our expectations.
Summary
I did not use Bonferroni correction because in this case , we need both Gross Conversion and Net Retention matric to be significant (statistically and practically) and if results show that any one of the matric is not significant , launch is not recommended. Therefore, Bonferroni correction in this case is not necessary. Also ,in this experiment , we are not considering FWER , family wise error rate, and bonferroni correction can actually lead to false negatives
Recommendation
My recomendation is not to launch. We can design a follow-up experiment at this point.
This experiment was designed to determine whether filtering students as a function of study time commitment would improve the overall student experience without significantly reducing the number of students who continue past the free trial. A statistically and practically signficant decrease in Gross Conversion was observed but with not in Net Conversion. This translates to a decrease in enrollment not coupled to an increase in students staying for 14 days boundary to trigger payment.
I think udacity should not launch this change even though Udacity could improve the overall student experience and improve coaches' capacity to support students who are likely to complete the course . This decision is in line with our hypothesis that the results might set clearer expectations for students upfront but can impact revenues(net conversion matric). From the experiment results , we can see that second part of hypothesis “without significantly reducing the number of students to continue past the free trial and eventually complete the course” , which pertain to Net conversion matric does not hold true. Hence , it is not recommended to take the risk and launch the change.