Introduction
Ever wondered how Airbnb changed the entire dynamic of the Hoteling industry? Not only did Airbnb revolutionize the travel industry, but they are also one of the first startup “unicorns” to emerge in the mid-2000s and are emulated on every level – from their business model, search results, referral engines to their withholding hosts plans.
Airbnb is widely known for convincing people to open their homes and allow guests to stay. But ever imagined, how does Airbnb ensure these hosts are happy enough to keep renting out their property? Do they maintain a retaining strategy and how would that strategy be profitable to the company?
To design a retaining campaign, Airbnb needs to find out which properties to target. This case study aims to answer the questions related to the potential hosts who are likely to leave and the best way to retain them. Apart from implementing the retaining strategy, the study also aims to see the value addition due to this retention strategy.
Dataset
The dataset contains the attributes of 6559 properties listed on Airbnb at the end of 2015. The features included in the model are monthly reservations in the last one year, the number of months(nmon) and the ratings of the properties. The target variable is the attrition indicator. It is equal to 1 if a property left Airbnb at the beginning of 2016, and 0 otherwise.
Approach
The goal of this study is to find out which properties Airbnb should shortlist for their retaining campaign. The data provided gives us the total Airbnb properties available in 2016 at the beginning of the year. We wish to target the properties likely to leave by the end of 2016 with the retaining campaign, so that in 2017 we have higher number of hosts.l
Retaining Strategy Plan
We will be assuming that Airbnb’s profit is 15% of the revenue received by each property. The retaining campaign is explained as below:
Suppose that Airbnb can retain a property on its platform for sure for a year if it pays the host $1000 (to cover, e.g., its operational cost). We will be implementing a targeted retaining strategy by using the data of 6559 properties. This strategy will help us shortlist the properties that are likely to leave. Later, with the help of a property specific cutoff value for attrition probability, we will calculate the total profits from properties in the testing sample under the targeted retaining strategy.
Data Preparation - Training/Testing sample
The data is divided into a training sample (attr0) and a testing sample (attr1)
We will be using 3 methods to estimate the model for ‘attrition’ namely – lasso, classification tree and random forest. We will use these models to predict the attrition probability of each property in the testing sample. By looking at the deviance and error variance of the models, we will select the best model on which we would later use the retaining campaign.
Three types of Models
We will be considering 3 types of model for this exercise namely: Lasso regression, Classification Tree and Random Forests. The explanation of the models is provided below:
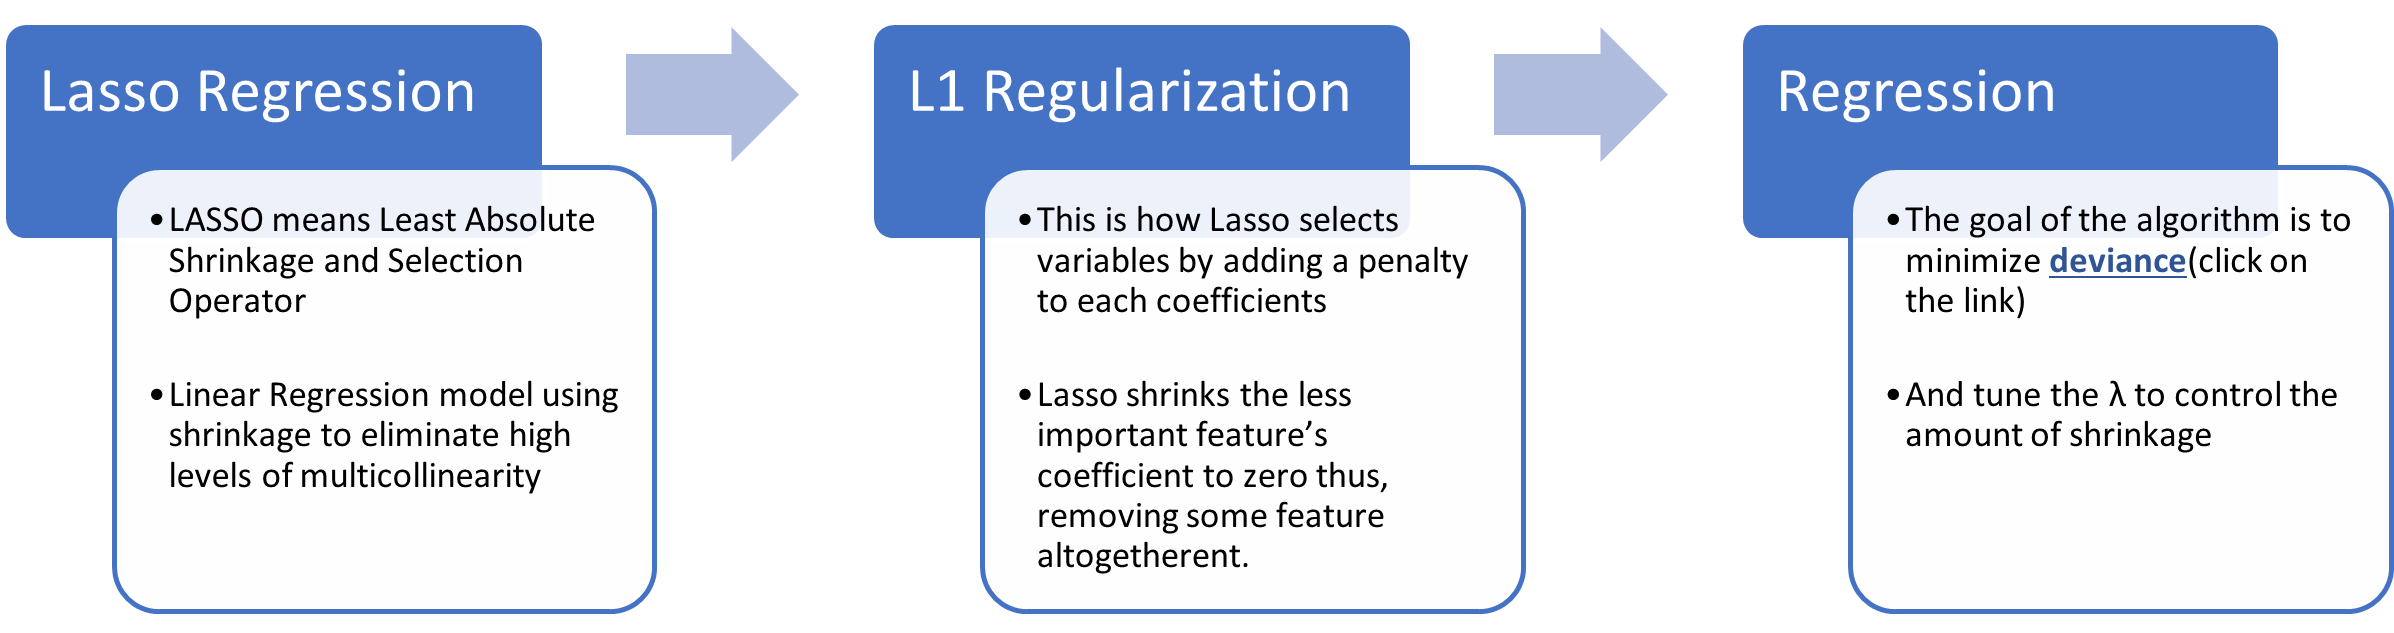
What is Lasso Regression?
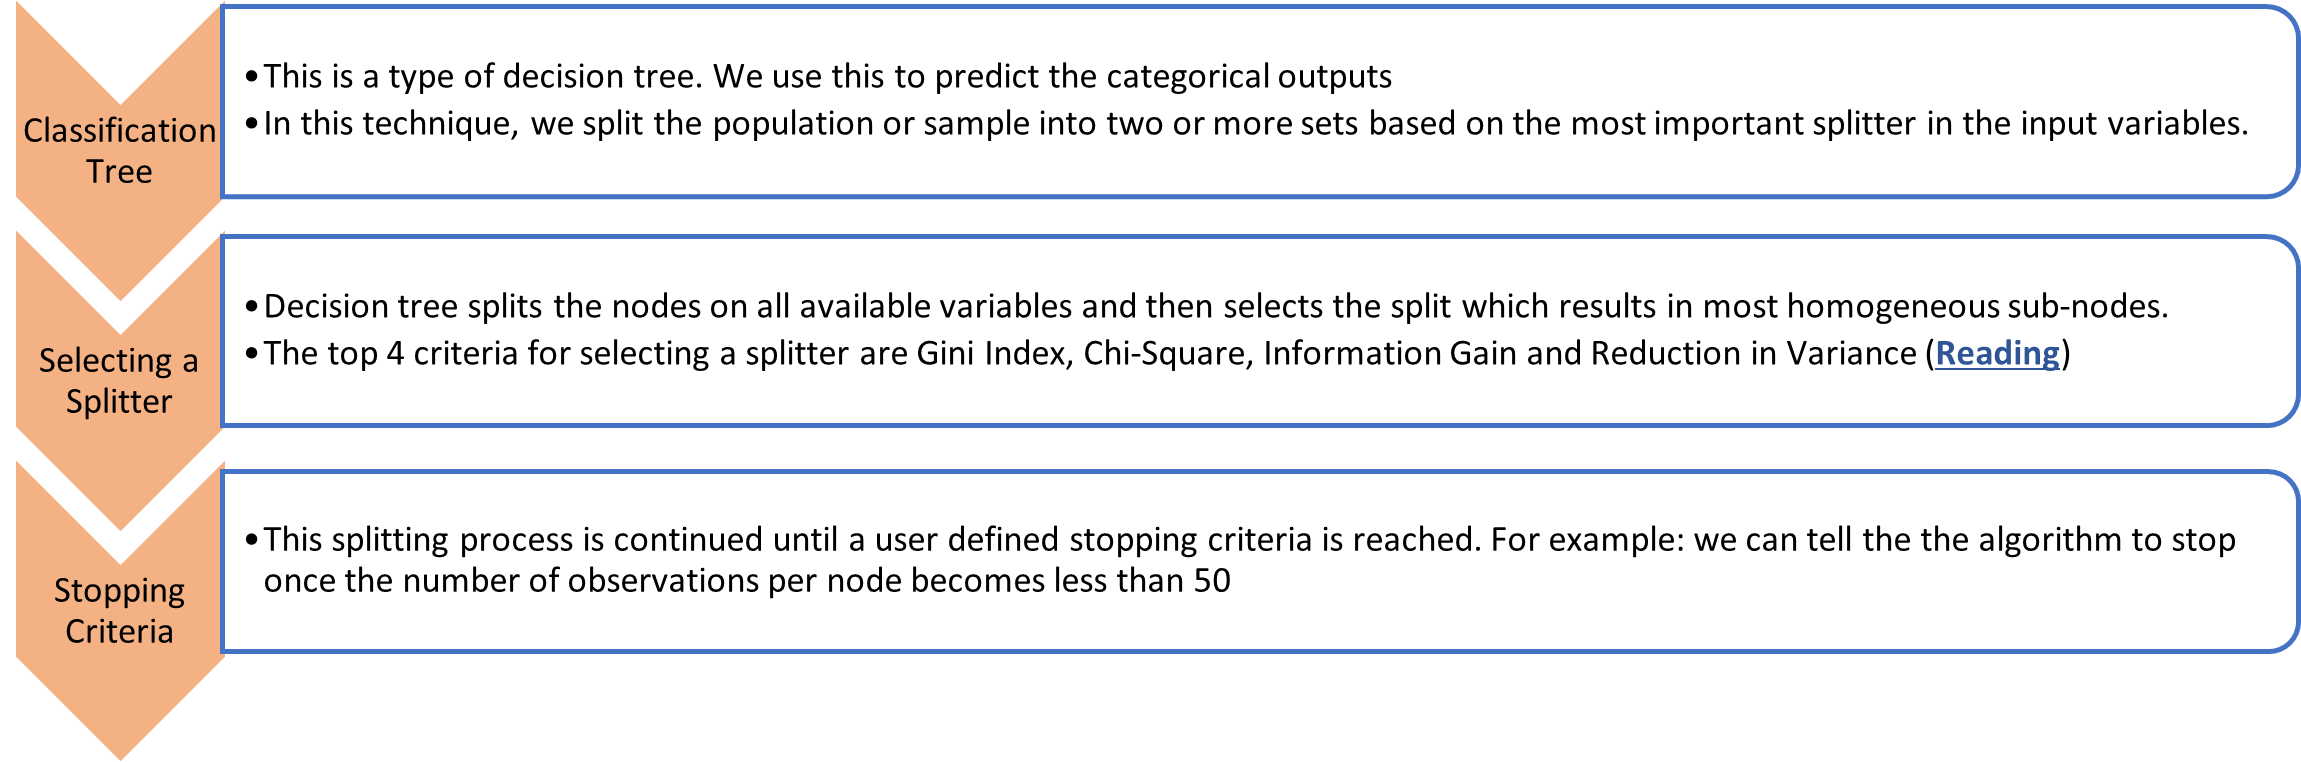
What is a Classification Tree?
Classification Tree for Airbnb (1 – Attrition, 0 – Retention)
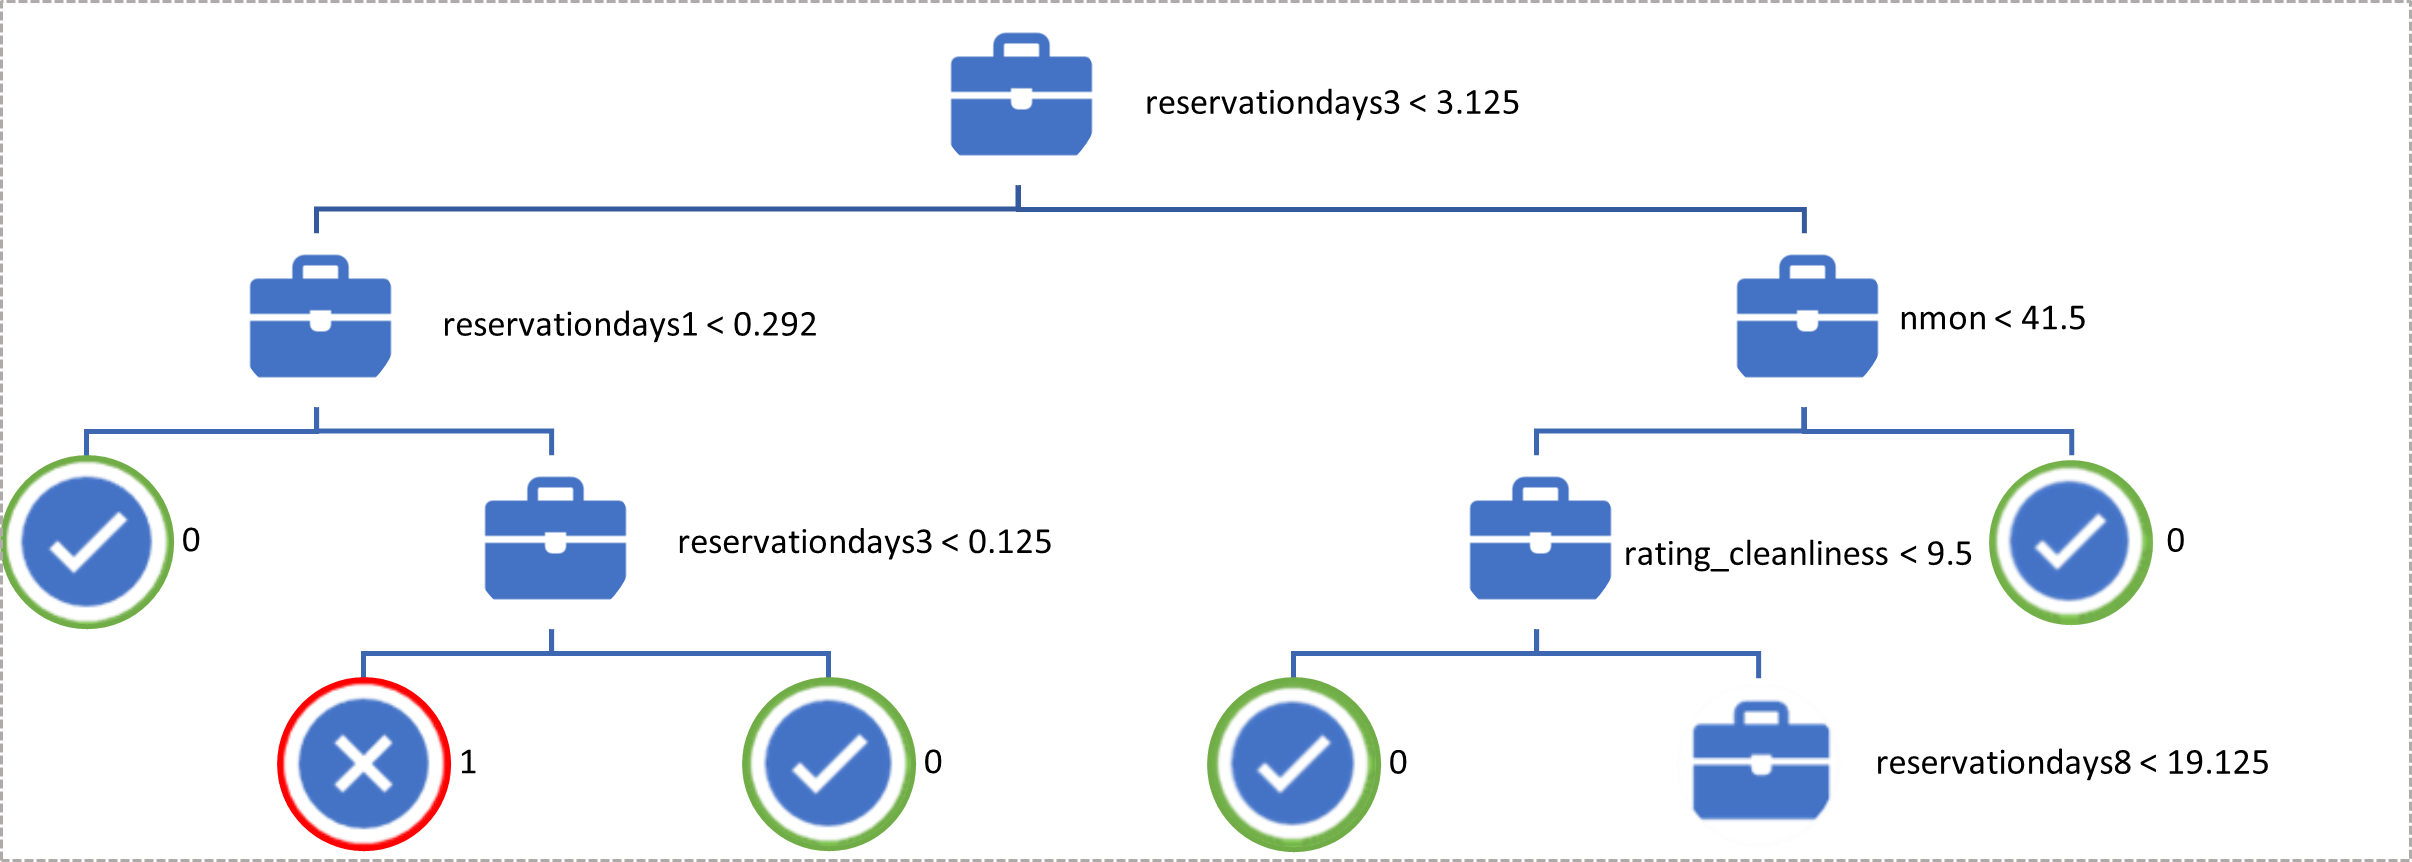
The classification tree calculates whether a property would be exiting or not. With the help of features provided in the model, the classification tree evaluates the attrition indicator. So, a property will be leaving Airbnb if it has reservationdays3 le 3.125, reservationdays1 >= 0.292 and reservationdays3 le 0.125
We can make numerous rules based on the above tree and use those rules to predict the outcomes for any future properties.
But, Unfortunately, it is tough to avoid overfitting with Classification Tree. Because, the deep tree structure is so unstable that optimal depth is not easily chosen via cross validation, and there is no theory to fall back on.
What are Random forests?
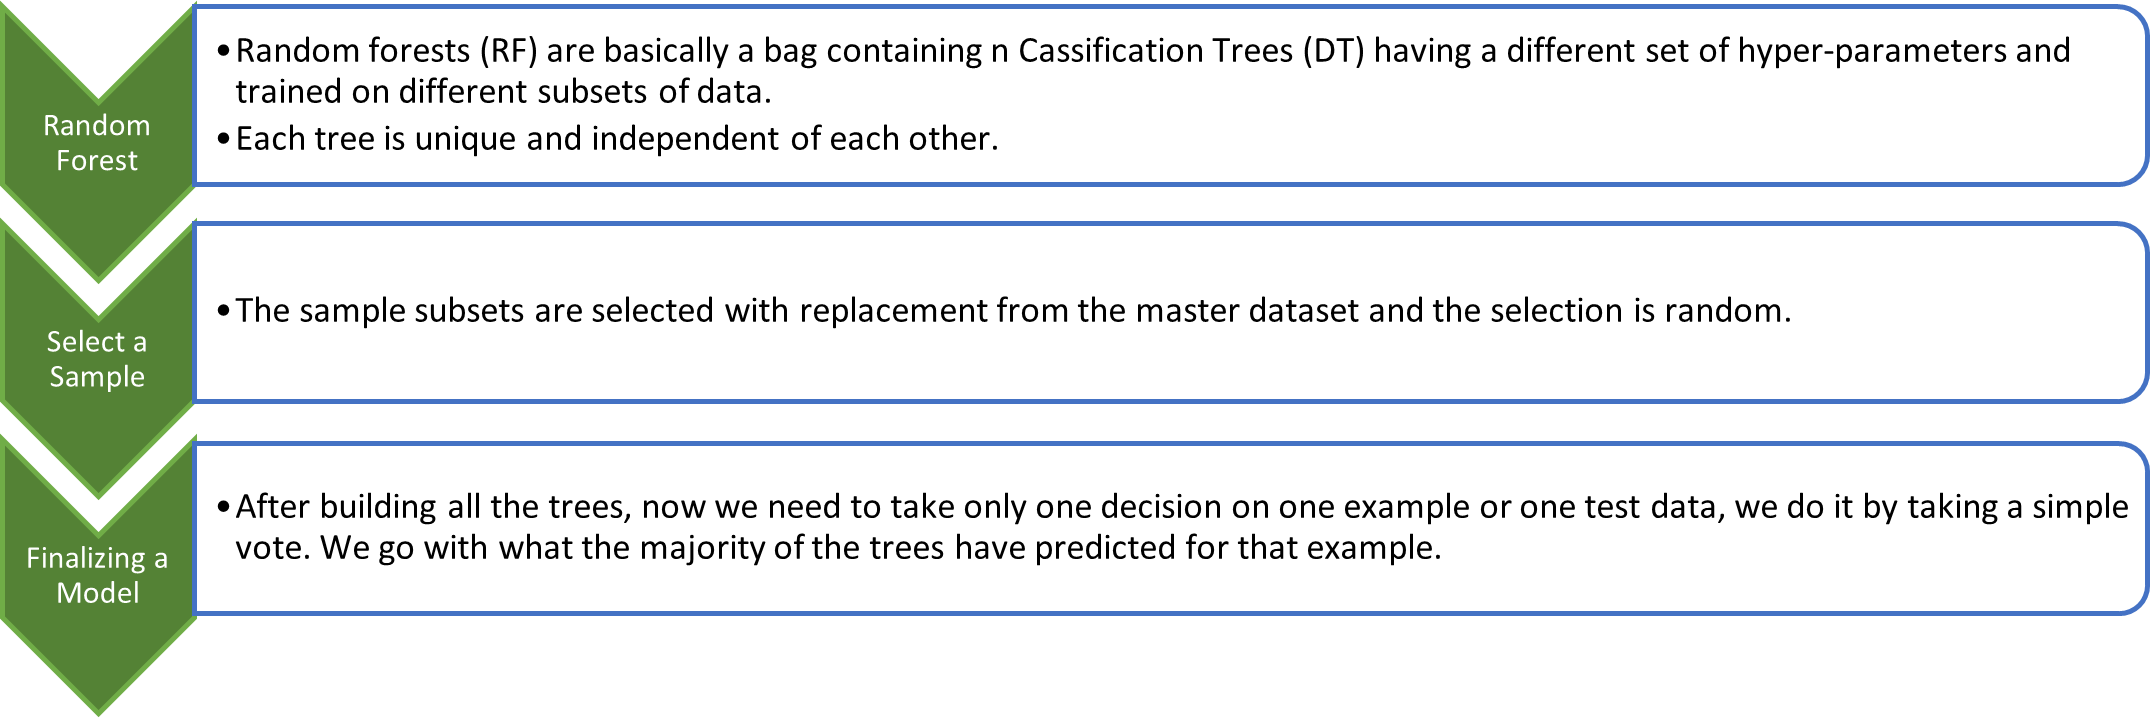
Sample Random Forest
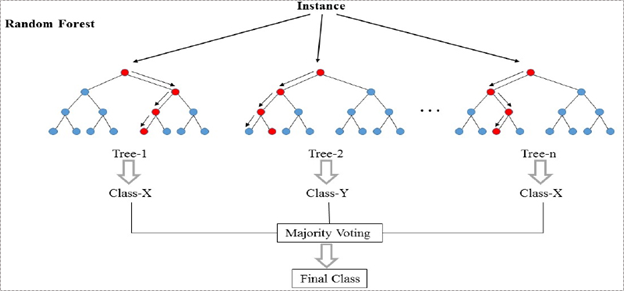
In the above picture, we can see how an example is classified using n trees where the final prediction is done by taking a vote from all n trees. In machine learning language, RFs are also called an ensemble or bagging method. I think the bagging word might have come from the analogy that we have just discussed!!!
Performance Metrics
We will be using the following performance metrics to identify the best model to fit for this problem:
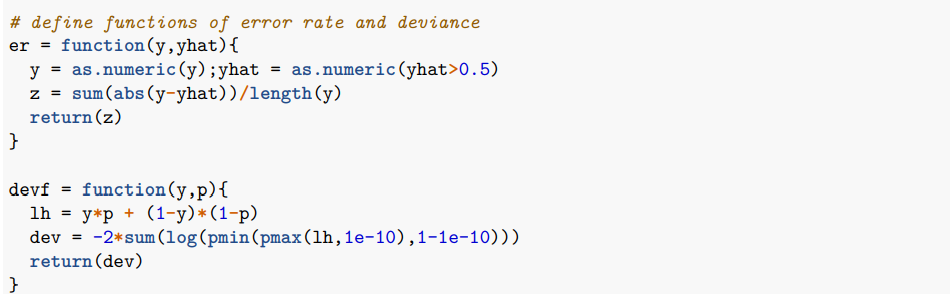
• Out-of-Sample (OOS) Error Rate - It is the ratio of the number of erroneous units of data to the total number of units of data transmitted. The erroneous unit are the sum of the difference between the actual values and the predicted values.
• Deviance - Deviance is the likelihood-ratio statistic for testing the null hypothesis that the model holds against the general alternative (i.e., the saturated model). The deviance provides a test for the model fit
Deviance = −2[L(μ^|y)−L(y|y)
We will be creating functions for error rate and deviances. The functions are encoded below:
Model Selection
Lesser the OOS error rate and the deviance, the better the model fit.
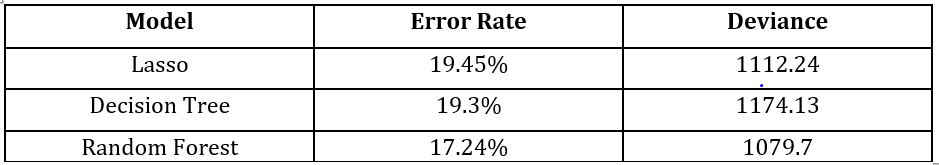
From the above table, we can see that the Random Forest model provides us with the lowest OOS error rate and deviance. Therefore, we will be using the Random Forest model for our future calculations as it provides us with the best fit.
Calculation of Total Profits
We have assumed that Airbnb’s total profit Is 15% of the revenue received from each property. The profit is calculated by multiplying 0.15 to average daily usd * total reservation days of that property.
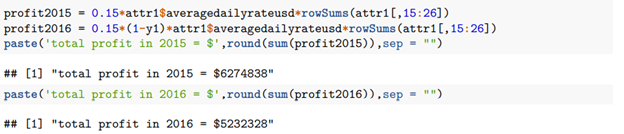
Airbnb’s total profit from the properties in the testing sample in the previous 12 months is $6.27M
Out of 1311 properties in the testing sample, there will be 276 attritions by the end of 2015. So we would only have 1035 properties left for 2016.
Airbnb’s total profit from the 1035 properties in the next 12 months i.e. 2016 is $5.23M
Implementation of the Targeted Retaining Strategy
Airbnb wishes to maintain its hosts and retain them. The company wishes to give the potential hosts who are expected to leave with an incentive of receiving $1000 annually to keep their property listed for operations. In this way, the company wants to implement a targeted retaining plan.
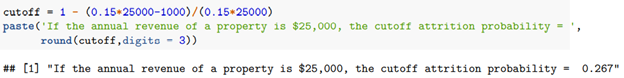
Calculation of cut off probability if the annual revenue is $25,000.
In order to understand which hosts are expected to leave, we need to calculate a cut off probability(p). The properties with a probability higher than the cut off probability will be targeted by the retaining strategy. Here we are assuming the annual revenue is $25,000 in order to understand the calculation of the cut off probability
Calculation of property specific cut off probability.
With the help of the profit data of 2015, we will be calculating the cut off probability for each property. We will be using our retaining strategy for hosts with a probability of exiting Airbnb higher than the cut off probability.

Calculation of Total Profits with the Targeted Retaining Strategy
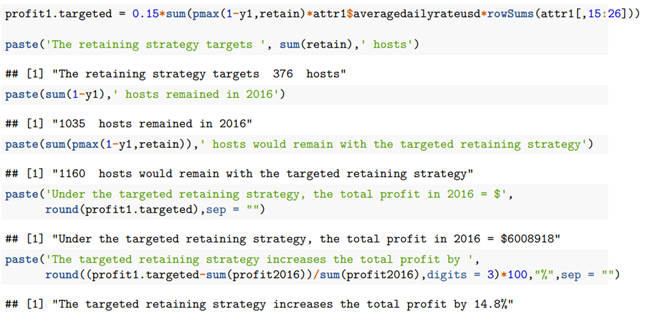
With the help of the cut off probability, we can calculate the number of hosts Airbnb needs to target.
Results of the Targeted Retaining Strategy
From the code above, we can see that the profit increased from $5.2M to $6.0M i.e., by 14.8%. This means that the retention strategy plan can make higher profits even after spending more on retaining hosts.
Conclusion
We have noticed that it is important to retain hosts for Airbnb to make higher profits. How will travelers or customers opt for Airbnb if there are not a wide variety of hosts? Higher the number of options for properties, higher the probability of customer needs being satisfied. Henceforth, it is eventually Airbnb’s duty to make sure the hosts are happy, and willing to host their properties online year after year. A retaining strategy like this could turn out to be a boon for the company if the attrition indicator of the hosts is predicted accurately.